Activity intelligence for competitive cycling
Certified data. A new model.
A new way to see.
Racing virtually is the biggest opportunity for exercise science research since the power meter.
It produces the closest thing to lab-controlled data that exists at population
scale: maximal efforts, consistent protocols, independent device recordings,
hundreds of thousands of athletes. The data has always been there. No one
built the tools to read it.
Raceproof compiles, cross-references, and certifies that data into a single
authoritative record. Then it analyzes what certified data makes visible:
seven bioenergetic thresholds where your physiology actually
shifts. Fourteen dimensions of athletic development, in a sport that has
measured one for over twenty years.
What we built
Every layer required the one below it.
When Banister published the impulse-response model in 1975 and Coggan translated it
into TSS, CTL, ATL, and TSB, they needed the same thing: certified data, a specific
schema, and a new visualization to make it legible. That framework defined endurance
training science for a generation. It has been largely stagnant since.
Raceproof is the next iteration, born from the data corpus that virtual cycling created. Three layers, each enabling the next.
01
Certified Data
Cross-source compilation and certification. Independent devices recording the same effort, resolved into a single authoritative record. When the data passes the governance process, it earns the badge.
02
Power Threshold Array
A new analytical model that replaces single-threshold FTP with seven bioenergetic transitions resolved across the full spectrum of human power output. Each corresponds to a distinct energy system. Together they form a fingerprint that develops along fourteen independent dimensions.
03
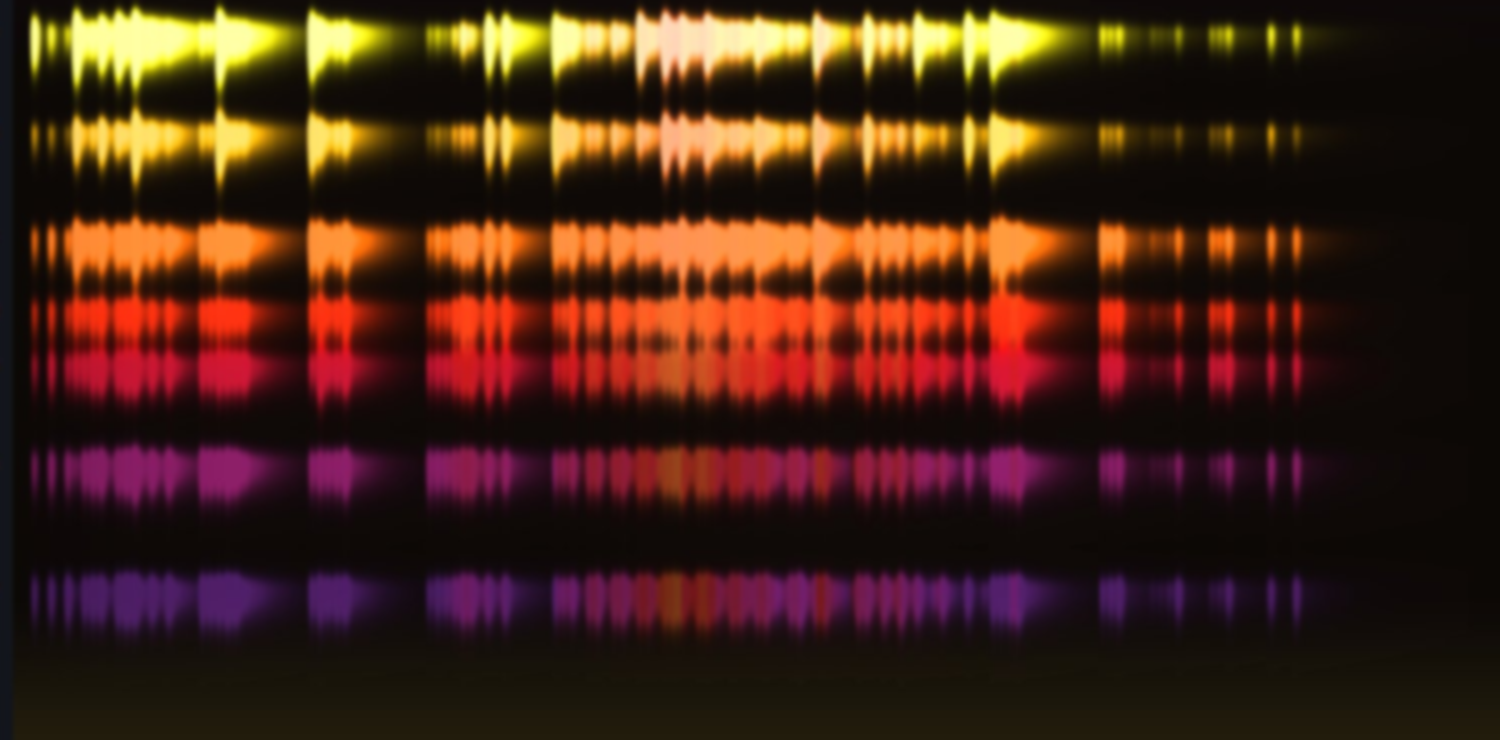
Effort Signature + Loom
Every ride has a shape. Raceproof captures it as an Effort Signature: your effort rendered as color against PTA thresholds. Sprint power burns gold at the top. Threshold effort glows deep plum at the bottom. Line up a season of signatures and they become Loom, a biographical view of athletic development over time.
How each layer works →
Research
The first population-scale evidence that racing develops the full physiological spectrum.
Not at a single FTP threshold, but across every duration from 5 seconds
to 20 minutes, for every rider in a validated four-year corpus. The data
required certification. The analysis required PTA. The findings required Loom to
present them.
+21.2W
Annual development gap between year-round and seasonal racers, all seven thresholds
2+ / wk
Average annual racing frequency above which whole-spectrum fitness development accelerates
145K
Classified riders in the validated four-year corpus
Read The Racing Effect →
Publication
Torque
Raceproof's research arm. Population-scale analysis of competitive cycling
fitness, rider behavior, and platform engagement. Four years of event data,
hundreds of thousands of riders.
Read Torque →